A few years ago, a project involved monitoring the growth of a bacterial culture in situ with very low cost equipment. This topic has come up recently and so i’m quickly collecting a few of my notes from that time here. Apologies that these are rough around the edges.
Turbidimetry (and its sister technique, nephelometry) has a long and well-developed history stretching back to the 1930s (Mestre, 1935, Alper, 1933) (when the electronic light sensor was still a unique and awesome tool). The concept is extremely simple and many designs (which are all undoubtedly much more polished than anything i could come up with,) are already available online, especially since cheap turbidimetry and nephelometry of water is an important topic for low-income countries. (Turbidity generally refers to the absorption of light in the transmission direction, whereas nephelometry typically uses a right-angle scattering geometry).
That said, when applied to in-situ online culture work, there are some specific nuances which make this worth addressing.
Conventional wet-lab spectrophotometers, turbidimeters, and nephelometers can usually rely on an optical grade cuvette with predictable dimensions. Despite how visually obvious the scattering from a medium-density culture can be, if you’re doing this on the cheap, the actual reduction in OD600 is often sufficiently small that minor variations in the optical path length, instabilities in the intensity of the light source, and small defects in the transmission or scattering path of the sample holder, can completely swamp the absorption signal you’re looking for. I have found that the mechanical tolerances required are surprisingly tight in certain geometries.
Again, in the initial phases of growth, the absolute reduction in transmitted light or increase in scattered light is very minor.
Also, an online system probably has other constraints, for instance to be autoclavable, or to have a certain geometry, like reading through through the side of an existing bioreactor or incubator.
Camera-based optical fourier transform turbidimetry.
This technique is, in my opinion, amazing. This essentially exchanges the hardware requirements for a small piece of software.
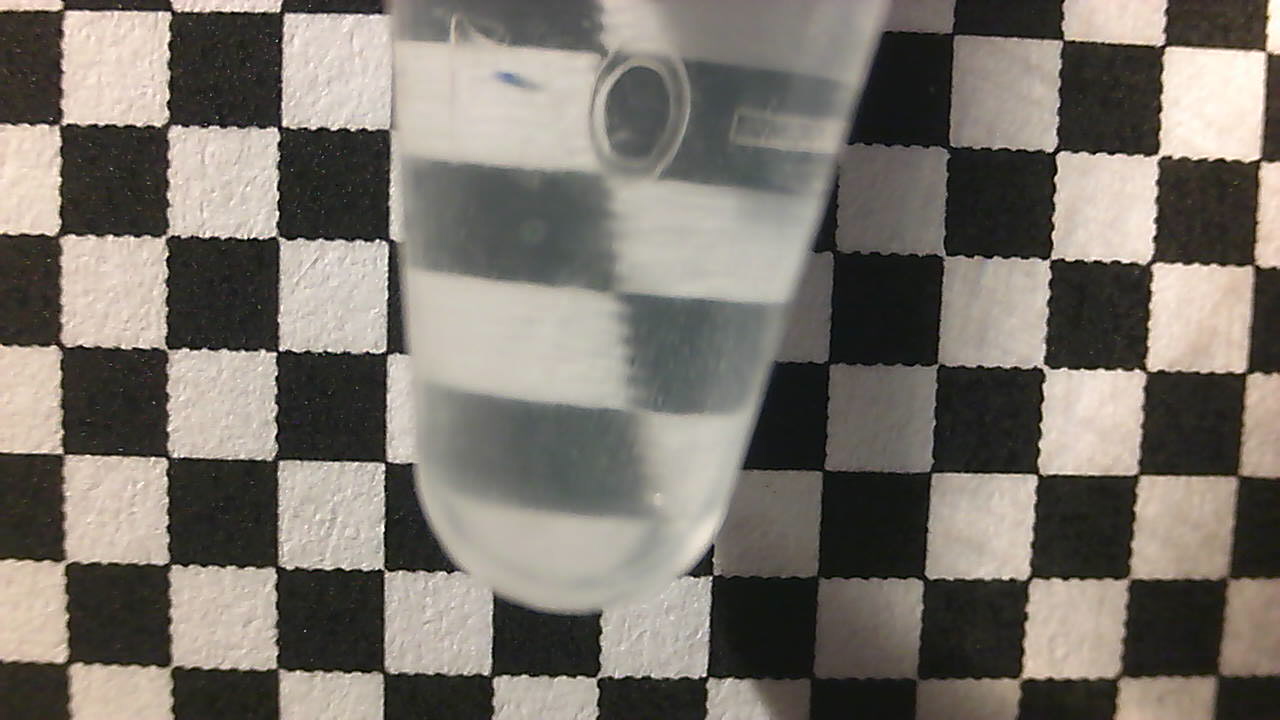
This idea is from (Kim 2016)[4] and (to a lesser extent) (Kim 2016)[14]. All that is needed is a stable positioning of a camera, a reasonably transparent cell of approximately stable dimensions (which can easily be the wall of the bioreactor), and a printed checkerboard pattern. The turbidity information is extracted from the blurring, rather than the darkening, of the checkerboard pattern. This blurriness is made quantitative by a 2d fourier transform of the image. This also has the advantage of not being a single-point measurement, instead spatially averaged over the entire sample, unlike the pointlike beam of some conventional turbidimeters.
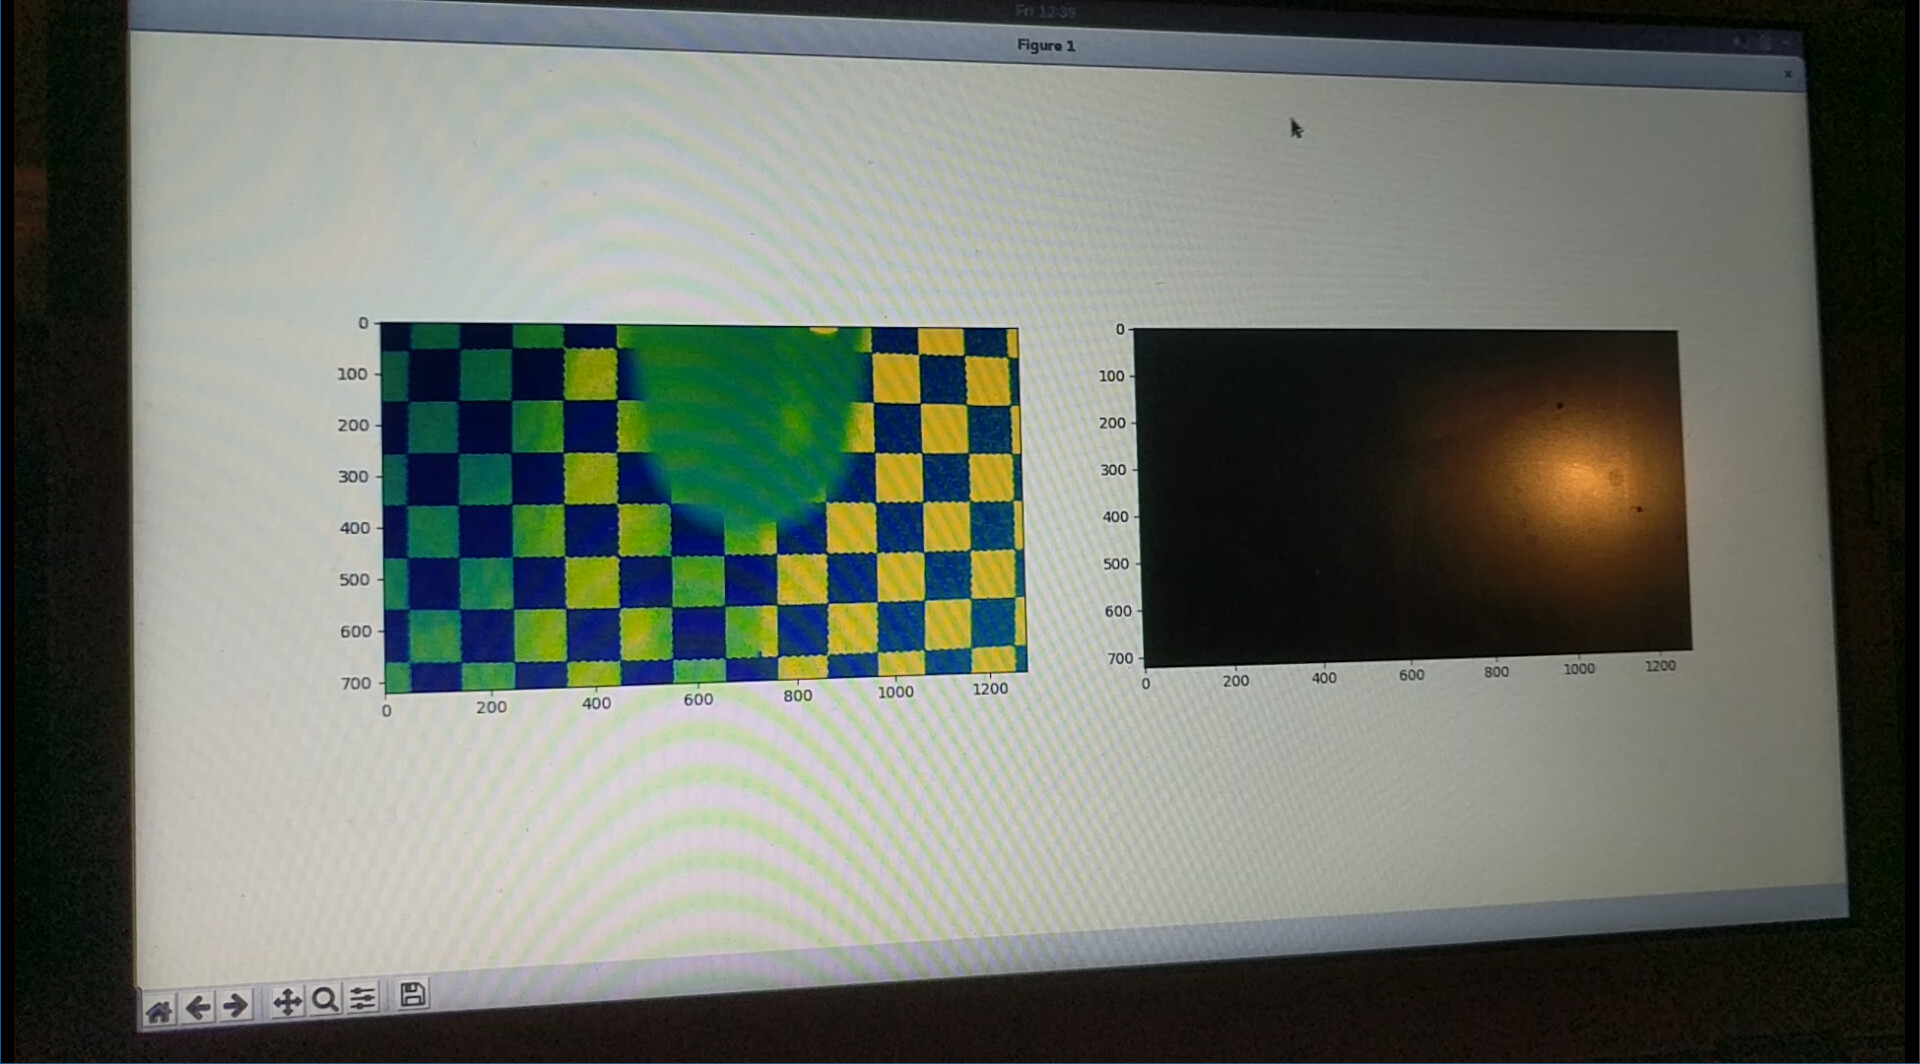

Uploading: Screenshot from 2023-03-13 23-16-29.png…
I haven’t yet collected together the notes and code for this project onto github, but here’s a little python script I played around with. Note: this code is absolutely hideous and inscrutable, please don’t judge me :)
turbidimeter.py (3.7 KB)
I didn’t need a calibrated result, so I don’t know how well this lends itself to absolute calibration.
Sidestep the problem by using an extremely opaque tracer.
Depending on your application and where in the growth phase you need the most resolution, it may be possible to improve the signal-to-noise ratio by adding a dye that indicates strongly in relation to growth. For instance, a beta-galactosidase indicator like X-gal, as used in blue-white screens.
Selected references
[1] GenericLab/TurbiGnUSB 2020.
[2] Tengerdy RP, Nagy JG, Martin B. Quantitative measurement of bacterial growth by the reduction of tetrazolium salts. Appl Microbiol 1967;15:954–5.
[3] Mellefont LA, Ross T. The effect of abrupt shifts in temperature on the lag phase duration of Escherichia coli and Klebsiella oxytoca. International Journal of Food Microbiology 2003;83:295–305. Redirecting.
[4] Kim K, Choi D, Lim H, Kim H, Jeon JS. Vision Marker-Based In Situ Examination of Bacterial Growth in Liquid Culture Media. Sensors (Basel) 2016;16. Vision Marker-Based In Situ Examination of Bacterial Growth in Liquid Culture Media.
[5] Why is 600nm wavelength recommended for optical density check of bacteria culture and is there any literature to back it? ResearchGate n.d. https://www.researchgate.net/post/why_is_600nm_wavelength_recommended_for_optical_density_check_of_bacteria_culture_and_is_there_any_literature_to_back_it (accessed April 11, 2020).
[6] von Wulffen J, Sawodny O, Feuer R. Transition of an Anaerobic Escherichia coli Culture to Aerobiosis: Balancing mRNA and Protein Levels in a Demand-Directed Dynamic Flux Balance Analysis. PLoS One 2016;11. Transition of an Anaerobic Escherichia coli Culture to Aerobiosis: Balancing mRNA and Protein Levels in a Demand-Directed Dynamic Flux Balance Analysis.
[7] Singh S. Optimizing Phagehunting Methods to Isolate and Amplify Bacteriophages Shriya Singh, Enrique Assad-Garcia, Nacyra Assad-Garcia, Lauren Oldfield, Sanjay Vashee, and Derrick E. Fouts J. Craig Venter Institute, Rockville, MD n.d.:1.
[8] Richards JCS, Jason AC, Hobbs G, Gibson DM, Christie RH. Electronic measurement of bacterial growth. J Phys E: Sci Instrum 1978;11:560–8. Radware Bot Manager Captcha.
[9] Revie D. Determination of phages in soil n.d.:2.
[10] O’Connor R, O’Driscoll L. Setting up a Cell Culture Laboratory n.d.:7. Redirecting.
[11] Mestre H. A Precision Photometer for the Study of Suspensions of Bacteria and Other Microorganisms. J Bacteriol 1935;30:335–58.
[12] Manafi M, Kneifel W, Bascomb S. Fluorogenic and chromogenic substrates used in bacterial diagnostics. Microbiol Rev 1991;55:335–48.
[13] Kitchener BGB, Dixon SD, Howarth KO, Parsons AJ, Wainwright J, Bateman MD, et al. A low-cost bench-top research device for turbidity measurement by radially distributed illumination intensity sensing at multiple wavelengths. HardwareX 2019;5:e00052. Redirecting.
[14] Kim K, Kim S, Jeon JS. Visual Estimation of Bacterial Growth Level in Microfluidic Culture Systems. Sensors 2018;18:447. Visual Estimation of Bacterial Growth Level in Microfluidic Culture Systems.
[15] Johnson FH, Lewin I. The growth rate of E. coli in relation to temperature, quinine and coenzyme. Journal of Cellular and Comparative Physiology 1946;28:47–75. https://doi.org/10.1002/jcp.1030280104.
[16] Gillett D, Marchiori A. A Low-Cost Continuous Turbidity Monitor. Sensors (Basel) 2019;19. A Low-Cost Continuous Turbidity Monitor.
[17] Alper T, Sterne M. The Measurement of the Opacity of Bacterial Cultures with a Photo-electric Cell. J Hyg (Lond) 1933;33:497–509.